ffmpeg -i in.mp4 -lavfi showspectrumpic=s=1024x512 spectrogram.png draws a whole track as frequency over time. The axes make it 1308x640; legend=0 keeps it at 1024x512. ReelSDK makes one for under a fifth of a cent ($0.02 per compute minute).
Make a spectrogram with ffmpeg
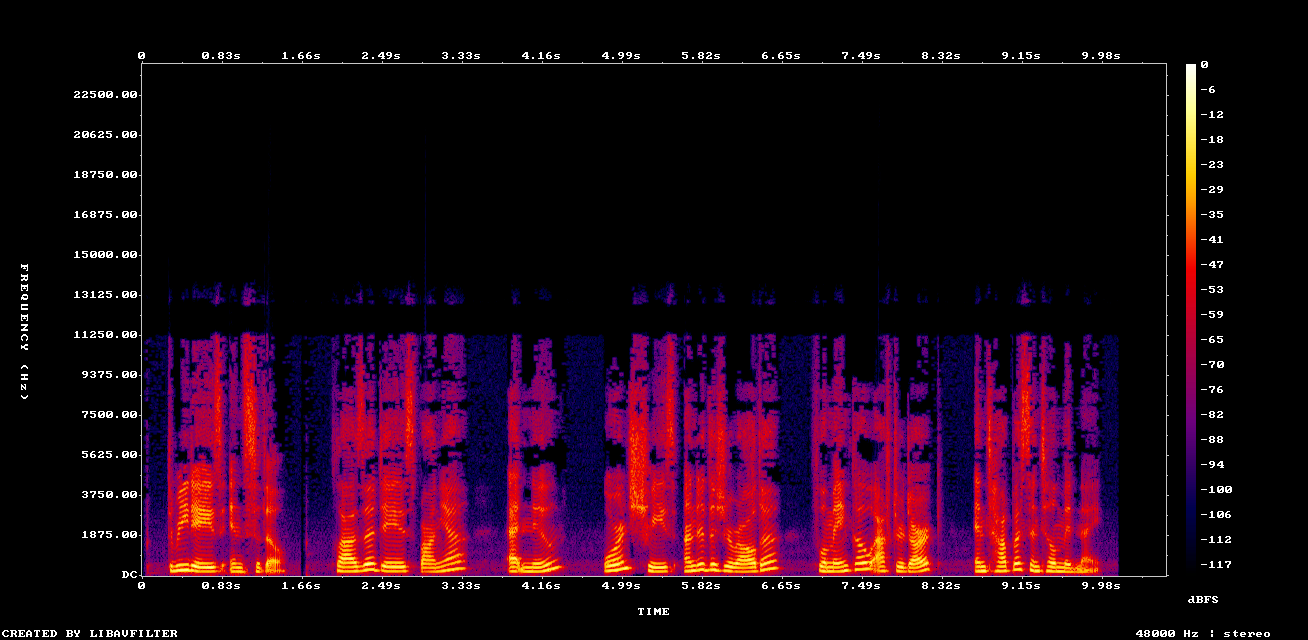
One filter, showspectrumpic, draws every frequency over time; ReelSDK's API drew this one in under 4 seconds. It shows what a bitrate hides: audio that went through a 24 kHz sample rate stops dead at 12 kHz.

GuidesUpdated
ffmpeg -i in.mp4 -lavfi showspectrumpic=s=1024x512 spectrogram.pngs sets the plot area; the time and frequency axes are added around it, so the PNG comes out at 1308x640.
Variations
The other commands you will need
Exactly the size you ask for
legend=0drops the axes: 1024x512, nothing around it. Use this when the image goes into a layout of its own.no legend ffmpeg -i in.mp4 -lavfi showspectrumpic=s=1024x512:legend=0 plot.pngZoom into speech
A log frequency scale gives the low range, where voices live, most of the height;
stopends the plot at 12 kHz.log scale ffmpeg -i in.mp4 -lavfi showspectrumpic=s=1024x512:fscale=log:stop=12000 speech.pngA scrolling spectrogram video
overlap=0.9makes enough columns to fill the frame;fps=30turns them into normal video next to the audio.scrolling ffmpeg -i in.mp4 -filter_complex \ "[0:a]showspectrum=s=1080x1080:slide=scroll:overlap=0.9,fps=30,format=yuv420p[v]" \ -map "[v]" -map 0:a -c:v libx264 -crf 20 -c:a copy spectrum.mp4
The flags
The options in these commands
| Flag | What it does | Used here |
|---|---|---|
-lavfi | Runs a filter graph that may change the stream type, here audio to image | Images |
s=1024x512 | Size of the plot area | Images |
legend=0 | Leaves out the axes; showspectrumpic draws them by default | No legend |
fscale=log | Logarithmic frequency axis instead of linear | Log scale |
stop=12000 | Highest frequency on the plot, in Hz | Log scale |
slide=scroll | Video mode: the picture scrolls left as new columns arrive | Scrolling |
overlap=0.9 | Overlaps the analysis windows so more columns are made; the default is 0 | Scrolling |
fps=30 | Turns the column rate into a steady 30 fps | Scrolling |
Sources: ffmpeg filters: showspectrumpic, ffmpeg filters: showspectrum, checked November 2026.
Reading the picture
Time runs left to right, frequency bottom to top, and brightness is how loud each frequency is. Speech shows up as stacked bands that move with the voice, with gaps where the speaker breathes.
The useful part is often what is missing. Our clip has nothing above 12 kHz across its whole length; we measured the band just above that line at close to silence. A flat ceiling like that means the audio was cut off before it reached us. A sampled signal holds frequencies only up to half its sample rate, so audio that passed through 24 kHz stops at 12 kHz, and lossy encoders cut the top end on purpose. A file that claims to be high quality but shows a low ceiling was likely made from a worse copy.
Why the image is bigger than you asked
showspectrumpic draws axes and a color scale by default, outside the plot. We asked for 1024x512 and got 1308x640. Set legend=0 when you need exact pixels, as in a page layout or another overlay.
Why a scrolling spectrogram crawls
In video mode, showspectrum makes one column per analysis window and, at the default overlap of 0, one frame per column. For our clip that was about 22 frames per second, so by the end the scroll had crossed only about a fifth of a 1080-pixel frame.
With overlap=0.9 the windows overlap and the filter made about ten times as many columns, enough to cross the frame in under 5 seconds. Its own frame rate is then very high, so fps=30 brings it back to normal video that plays next to the audio.
Without installing ffmpeg
The same command as one API call
Send the same args to POST /v1/ffmpeg with the file URL in inputs. Each job runs ffmpeg 8.1 on a fresh machine at $0.02 per compute minute, billed per second; this one finished in a few seconds and cost under a fifth of a cent.
curl "https://api.reelsdk.com/v1/ffmpeg?wait=60" \
  -H "Authorization: Bearer $REELSDK_KEY" \
  --json '{
    "inputs": {
      "in.mp4": "https://api.reelsdk.com/f/lib/demo/clip.mp4"
    },
    "args": [
      "-i", "in.mp4", "-lavfi", "showspectrumpic=s=1024x512",
      "spectrogram.png"
    ],
    "outputs": ["spectrogram.png"]
  }'
FAQ
Questions, answered
How do I make a spectrogram with ffmpeg?
Run ffmpeg -i in.mp4 -lavfi showspectrumpic=s=1024x512 spectrogram.png. It writes one PNG of the whole track with time and frequency axes.
Why is my spectrogram PNG not the size I set?
The legend is drawn outside the plot area. With s=1024x512 the file came out 1308x640; add legend=0 to get exactly 1024x512.
How can a spectrogram show a fake high-quality file?
Look for a hard ceiling across the whole track. Audio with nothing above 12 kHz or so came from a low sample rate or a lossy encode, whatever the file's bitrate says now.
Can I make spectrograms with an API?
Yes. POST the same args to https://api.reelsdk.com/v1/ffmpeg with the audio or video URL in inputs and spectrogram.png in outputs. It runs ffmpeg 8.1 for $0.02 per compute minute, billed per second.
- Make an audio waveform with ffmpegDraw a waveform PNG with showwavespic or a moving audiogram video with showwaves, in the exact color you ask for.
- Extract audio from a video with ffmpegCopy the AAC track out of an MP4 without re-encoding, or convert it to MP3 or WAV, with the file size each command produced.
- Normalize audio loudness with ffmpeg loudnormBring any track to a loudness target such as -14 LUFS with loudnorm: one pass, or a measured second pass that keeps the dynamics.
- Remove silence from audio with ffmpegTrim dead air at the start, shorten long pauses with silenceremove, or cut the matching video with select and aselect.
- ffmpeg -filter_complex explainedLabels, commas and semicolons: how a filtergraph wires inputs to outputs, with four working graphs and the errors they fix.
- Audiogram APITurn a podcast clip and cover art into a vertical waveform video with burned-in captions, using two API calls.
- Audio to waveform videoTurn a song or podcast clip into an MP4 with a moving waveform: free here, or one POST /v1/ffmpeg call with the same filter graph.
- FFmpeg onlineRun your own ffmpeg command on your files in the browser, free and without installing or uploading anything.
Sources, checked November 2026
Ready to build?
Ship video from your app today
Your first $0.50 is free, and one key covers every endpoint.
